VFD Power Quality Diagnostic
From drive trips and nuisance alarms to a clear electrical story and a short list of realistic options.
Our Discovery is a structured VFD power-quality diagnostic. We combine decades of hands-on VFD and motor design experience with Category A power-quality measurements to join the dots:
grid → PFC → drives → cables → motors … and back again.
Instead of leaving you with raw waveforms and a long PDF, you get one integrated electrical story and a set of practical, ranked actions you can actually take – from “fix now” to “monitor and plan”.
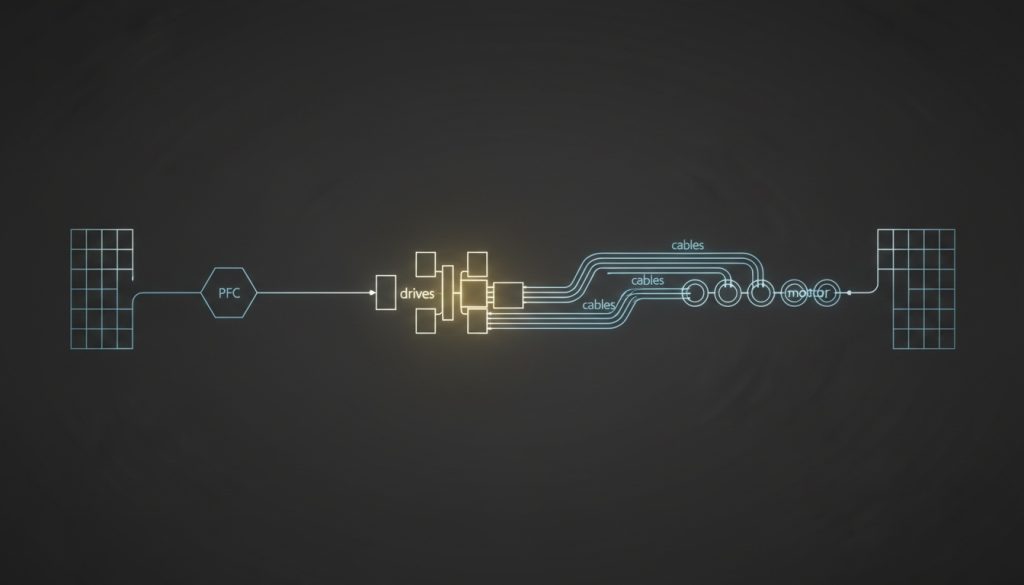
This diagnostic combines deep VFD and motor design experience with category A power-quality measurements. Instead of leaving you with raw waveforms and a long PDF, it traces one electrical story from grid, through PFC, drives, cables and motors, and back to the supply. It is the integrated story that sheds light on the steps to take next.
Our Diagnostic Clarity Guarantee
If, after you act on the practical recommendations that are reasonably within your control, the same PQ/VFD symptom still persists, the diagnostic stays live.
It includes one follow-up survey at no additional diagnostic fee. Where further diagnostic work is appropriate, we discuss options openly and can set out a fair credit from the original diagnostic fee.
What we actually do
This is a structured Power-Quality Diagnostic (PQD) – a defined piece of work that:
- Looks at power quality, drives, cables, motors and return paths as one system,
- Starts from the symptoms you care about – trips, shutdowns, failures – not abstract waveform purity,
- Concludes with a small set of ranked options you can act on.
It is not a generic survey, and it is not a magic wand. The right kind of help starts with understanding how the electrical landscape is supposed to look and measure, combined with detailed knowledge of:
- VFDs and their electrical/electronic behaviours
- Cables and their interactions
- Motors and their responses to real world power delivery
None of this would be any use without context from the people who run the plant and know what causes pain or nuisance.
There is a “walk and talk” element: we see the equipment and talk to operators and maintenance as we go. This isn’t a social chat – it’s a friendly, focused uptake of crucial clues.
The focus is directed to the trouble-causing devices – the drives that trip, the motor that keeps getting new bearings – rather than ticking every box on an asset register.
How the PQD runs
This is typically a 2-day engagement for one site, or one clearly defined part of a site.
Day 1 – Discover & capture context
- Confirm the problem machines / lines to focus on.
- Use a Category A power-quality analyser (e.g. Fluke 1777) for targeted power-quality capture at the points that actually matter, under realistic operating conditions (starts, stops, known awkward periods if possible).
- Take drive and motor measurements so you can see what reaches the motors, not just what appears at the switchboard.
- Walk the installation to understand cabling, earthing/grounding, PFC, filters, harmonic equipment and protection as a single system, not isolated components.
- Capture the stories from operators and maintenance – when trips occur, which lines are worst, and what has already been tried.
Day 2 – Join the dots and rank options
- Correlate events and symptoms (trips, alarms, nuisance behaviour) with measured voltage and current behaviour.
- Map the story from grid → PFC → switchboards → drives → cables → motors and back again.
- Identify where the real constraints and weak points are – and where an apparent problem is actually a consequence of something further upstream.
- Assemble a plain-language electrical story that links symptoms, measurements and practical options.
How the PQD lands
You do not need another thick document that lives on a shelf. You need a clear concise summary that helps different people make decisions.
Summary
- Plain language:
- What is actually happening,
- How it shows up as trips, downtime or early failures
- More technical:
- Insight into cause & effect
- Suggestions for remedial action at plant level
- Strategy for company (post survey approaches, training options etc.)
Who this suits
- Operations / Production
- fewer nuisance stops
- a clear link between symptoms and causes
- decision makers who need Return on Investment (ROI) – reduce shut down costs by correcting X problem(s)
- Maintenance / Electricians
- Plant-specific diagnostic
- Insight into the realities that have fallen between the technical cracks
- Finance / Leadership
- Defined, capped engagement
- Clear scope
- Pathway that moves from one-off diagnostic, through a programme, to strategic support if that is appropriate.
You can find out about the e-book here